Bitcoin Price Prediction: BTC Tumbles Near $113k Ahead Of FOMC Interest Rate Decision
The Bitcoin price edged down a fraction of a percent in the past 24 hours to trade at $113,618 as of 4:03 a.m. EST on trading volume that jumped 25% to $67.4 billion.
Traders are positioning cautiously ahead of the Federal Open Market Committee (FOMC) interest rate decision today, which is widely expected to see a 25 basis point cut in the benchmark rate.
⚠️ Volatility Alert 🎢
Fed rate cut decision today at 11:30 pm (IST)
Crypto market is in pressure and #Bitcoin stuck between $110K and $116K as most of the people await Fed rate decision and US-China deal. pic.twitter.com/rzjw2rax64
— BITCOIN EXPERT INDIA (@Btcexpertindia) October 29, 2025
While already priced in, it would be a positive for higher-risk assets like crypto because it will help boost liquidity by reducing the cost of capital.
Traders are carefully watching the liquidity situation following signs of renewed stress among US regional banks, and a still-uncertain global macro environment.
Can a rate cut push the price of Bitcoin higher?
Bitcoin Price Consolidates Near Key Support As Bulls Defend $113K Region
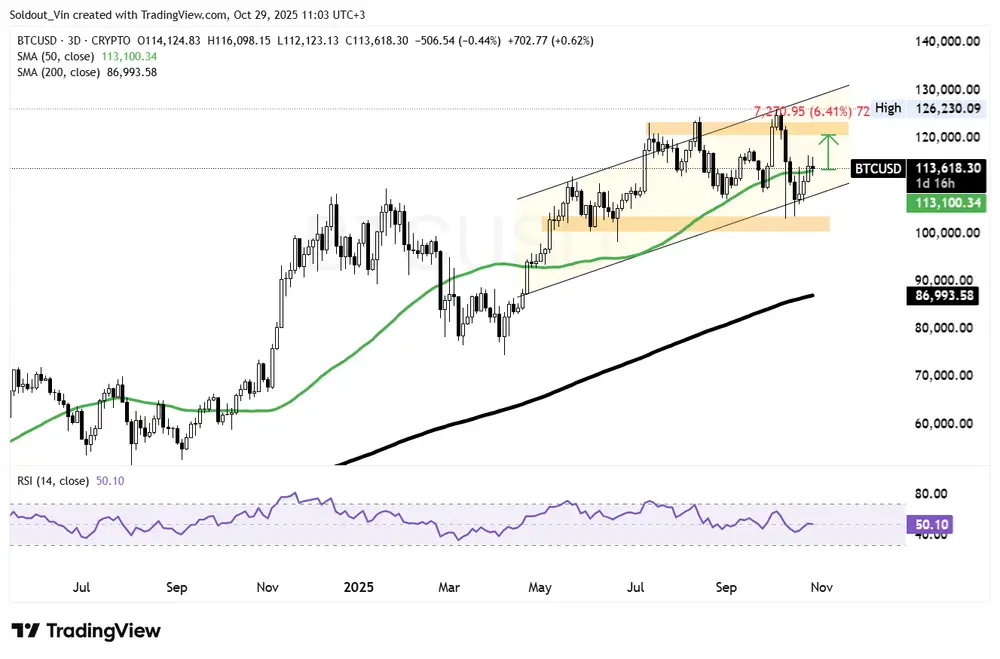
The BTC price is showing early signs of exhaustion after failing to sustain momentum above the $120,000 zone, as the market consolidates within a narrowing, rising channel.
Currently trading around $113,618, the Bitcoin price is holding slightly above the 50-day Simple Moving Average (SMA) at $113,100, a critical short-term support level that has guided the bullish rally since mid-2025.
The price of BTC action has turned cautious after multiple rejections near the upper boundary of the rising channel, around $126,000, where sellers have consistently capped any attempts to break out. This zone has now become the primary resistance level for Bitcoin’s price.
Meanwhile, the 200-day SMA, currently around $86,993, remains well below the BTC price, reinforcing the macro structure’s bullishness.
However, the short-term trajectory is increasingly fragile as the 50-day SMA flattens, suggesting a potential loss of upward momentum.
The Relative Strength Index (RSI) stands at 50.10, indicating that BTC is in equilibrium, neither strongly bullish nor bearish. This suggests the market is in a phase of indecision, awaiting a catalyst to determine the next major move, in this case, the FOMC decision.
BTC Targets The $120,800 Zone
From a structural standpoint, the $113,000–$115,000 zone now serves as the make-or-break support area, aligning closely with the 50-day SMA and the mid-range of the rising channel pattern.
A rebound from this level could spark renewed buying interest and drive the price of BTC back toward the $126,600 resistance band, approximately 6.4% from the current levels.
Conversely, a close below $113,000 may trigger deeper selling pressure, exposing the $105,000–$100,000 region, which coincides with the lower boundary of the rising channel boundary, which is also a historically strong demand zone.
This bearish sentiment is supported by TD Sequential, drawn by popular analyst on X, Ali Martinez, who says the sequence is flashing a sell signal.
TD Sequential has called every Bitcoin $BTC swing.
– July: Sell = 7% correction
– August: Sell = 13% correction
– Early September: Buy = 10% rebound
– Late September: Buy = 15% rally
– Early October: Sell = 19% correctionIt’s now flashing a sell signal! pic.twitter.com/kNoxWiY14l
— Ali (@ali_charts) October 29, 2025
For now, Bitcoin traders remain cautious, with sentiment balanced between bullish channel support and resistance pressure near all-time highs, as the FED rate cut decision looms.
Related News:
- Bitwise Spot Solana ETF Sets 2025 Record With $56M Debut Trading Volume
- Bitwise To Launch First Spot Solana ETF, Canary Capital Set To List Litecoin And HBAR Funds
- XRP Price Jumps 9% In a Week As Fed Rate Cut Odds For Wednesday Hit 97.8% On CME


Comments
Post a Comment