Dodo Price Drops 11% To $0.261 – Buy DODO Cheaply?
Dodo price is trading in the red after losing 10.79% over the last few days to exchange hands just above $0.26. Its daily trading volume was up 15.85% over the last 24 hours to stand at roughly $130 million. At the time of writing, DODO’s live market cap was $116.2 million, placing it at #257 on the CoinMarketCap ranking.
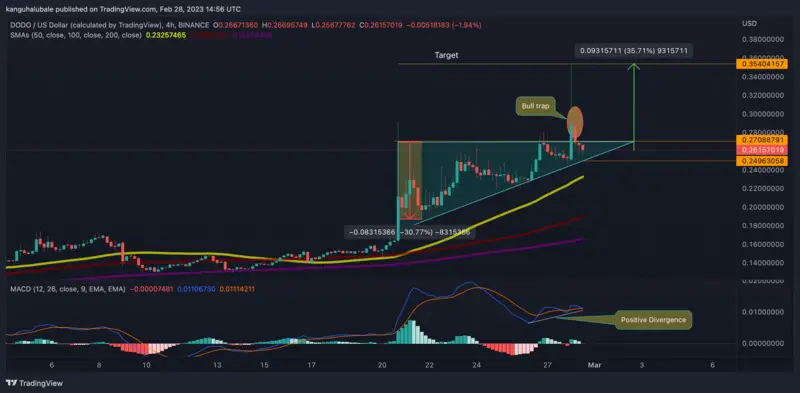
DODO Price Bulls May Exploit A Bullish Triangle Too $0.354
The Dodo price was rejected from the $0.30 level after a fakeout above the x-axis of the ascending triangle turned out to be a bull trap. On Tuesday, the bulls attempted to breach the aforementioned barrier without success. The bears sold on the rally causing the price to drop 2.55% in the last 24 hours to the current levels.
Ascending triangles are significantly bullish technical formations and feature exact breakout targets equal to the distance between the highest and the lowest points. The ascending trendline, as observed from the four-hour chart below, has been supporting the DODO price for more than one week. The same chart revealed the $0.25 level, where the ascending trendline of the triangle sat (hypotenuse), offered the launching pad Dodo needed for an immediate rebound.
As such, a daily candlestick above the said level would clear the path for an upward spiral taking the price above the $0.30 psychological level to reach the technical target of the governing chart pattern at $0.354. This would represent a 35.71% climb from the current price.
DODO/USD Four-Hour Chart

Several technical indicators supported the bullish outlook for DODO. To begin with, the Moving Average Convergence Divergence (MACD) indicator showed that there were still more buyers than sellers in the market. This trend-following indicator had a hidden bullish divergence, suggesting that the market conditions still favored the upside.
Moreover, the moving averages were facing up, indicating that the market was still bullish. They also offered robust support at $0.232, $0.189, and $0.165 levels embraced by the 50-four-hour simple moving average (SMA), 100 SMA, and the 200-SMA respectively. These provided potential breathing zones for bulls to regroup, adding credence to the bullish thesis.
On the downside, things could go awry if the ongoing correction becomes more pronounced and the buyer exhaustion conditions kick in, giving the DODO price a reason to drop further.
In such a case, $0.25 could be lost, with sellers quickly pulling the token toward the $0.165 and $0.22 demand zone, where the SMAs lay. This would simply be undoing all the gains posted over the last eight days. Another leg lower would see a revisit of the $0.160 support floor, invalidating the bullish narrative.
Promising Alternatives To DODO
The DODO price is in a downward move in its lower time frame, trading below the $0.270 resistance level embraced by the triangle’s x-axis. Meanwhile, there is the possibility of more upsides as the technical set chart shows that the price action is in an upward move, so we expect the buyers to move the price up and the $0.35 level may be the target in the coming days in its long-term view.
Meanwhile, investors may consider FGHT, the native asset of the Fight Out ecosystem. The team behind the Fight Out token has a solid track record in the industry and has laid out a clear roadmap for the development of the platform. In the ongoing presale, almost $5 million has been raised.
$4.8M RAISED 🔥
Our #Presale is getting closer to $5M! 💪
Remember, the price of $FGHT is increasing every 12 hours! ⏰⏰
Join the presale NOW before it's too late 👀
👉https://t.co/9pikKGRjSd#Blockchain #Crypto #PlayToEarn #Web3 pic.twitter.com/ULZmHm2V5w— Fight Out (@FightOut_) February 28, 2023
The presale will end on March 31, 2023. Visit Fight Out here to find out more.
Read More:
- MakerDAO Rejects $100 Million Loan To Cogent Bank
- Dogecoin (DOGE) Price Prediction: Will We See A Return To $0.09 Soon?
- How to Buy Bitcoin
Comments
Post a Comment